Linux vmstat Command Usage For Oracle DBA
vmstat – Report virtual memory statistics
vmstat is one of the most used tool for system performance monitoring. vmstat reports information about processes, memory, paging, block IO, traps, and cpu activity.
The first report produced gives averages since the last reboot. Additional reports give information on a sampling period of length delay. The process and memory reports are instantaneous in either case.
Display all memory information

vmstat syntax :
vmstat [options] [delay [count]]
Options:
The -a switch displays active/inactive memory, given a 2.5.41 kernel or better.

The -f switch displays the number of forks since boot. This includes the fork, vfork, and clone system calls, and is equivalent to the total number of tasks created. Each process is represented by one or more tasks, depending on thread usage. This display does not repeat.

The -m displays slabinfo.

The -n switch causes the header to be displayed only once rather than periodically.

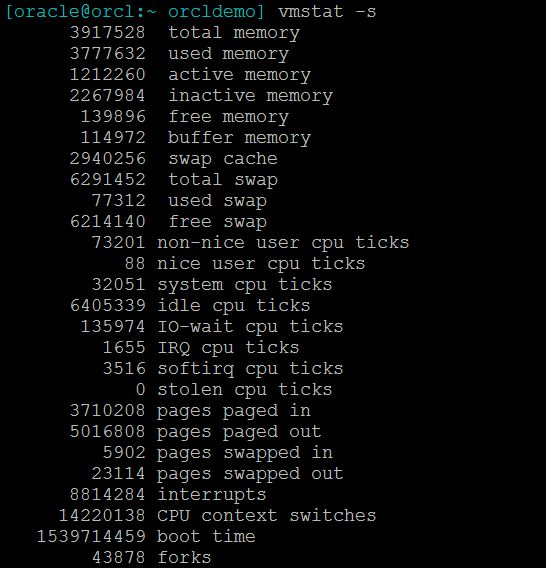
The -s switch displays a table of various event counters and memory statistics. This display does not repeat.

delay is the delay between updates in seconds. If no delay is specified, only one report is printed with the average values since boot.

count is the number of updates. If no count is specified and delay is defined, count defaults to infinity.

The -d reports disk statistics (2.5.70 or above required)

The -p followed by some partition name for detailed statistics (2.5.70 or above required)

The -S followed by k or K or m or M switches outputs between 1000, 1024, 1000000, or 1048576 bytes

The -V switch results in displaying version information.
Example:
1. Disks Statistics, vmstat with -d option display all disks statistics.

2. Execute vmstat ‘X’ seconds and (‘N’number of times). With this command, vmstat execute every two seconds and stop automatically after executing six intervals.

3. vmstat with timestamps

4. vmstat command with -s switch displays summary of various event counters and memory statistics.

5. vmstat in MB,

6. vmstat – Display number of forks since last boot
[oracle@orcl:~ orcldemo] vmstat -f
43982 forks
Columns values on vmstat output mode,
Procs
r: The number of processes waiting for run time.
b: The number of processes in uninterruptible sleep.
Memory
swpd: the amount of virtual memory used.
free: the amount of idle memory.
buff: the amount of memory used as buffers.
cache: the amount of memory used as cache.
inact: the amount of inactive memory. (-a option)
active: the amount of active memory. (-a option)
Swap
si: Amount of memory swapped in from disk (/s).
so: Amount of memory swapped to disk (/s).
IO
bi: Blocks received from a block device (blocks/s).
bo: Blocks sent to a block device (blocks/s).
System
in: The number of interrupts per second, including the clock.
cs: The number of context switches per second.

CPU These are percentages of total CPU time.
us: Time spent running non-kernel code. (user time, including nice time)
sy: Time spent running kernel code. (system time)
id: Time spent idle. Prior to Linux 2.5.41, this includes IO-wait time.
wa: Time spent waiting for IO. Prior to Linux 2.5.41, included in idle.
st: Time stolen from a virtual machine. Prior to Linux 2.6.11, unknown.


FIELD DESCRIPTION FOR DISK MODE
Reads
total: Total reads completed successfully
merged: grouped reads (resulting in one I/O)
sectors: Sectors read successfully
ms: milliseconds spent reading
Writes
total: Total writes completed successfully
merged: grouped writes (resulting in one I/O)
sectors: Sectors written successfully
ms: milliseconds spent writing
IO
cur: I/O in progress
s: seconds spent for I/O
FIELD DESCRIPTION FOR DISK PARTITION MODE
reads: Total number of reads issued to this partition
read sectors: Total read sectors for partition
writes : Total number of writes issued to this partition
requested writes: Total number of write requests made for partition
FIELD DESCRIPTION FOR SLAB MODE
cache: Cache name
num: Number of currently active objects
total: Total number of available objects
size: Size of each object
pages: Number of pages with at least one active object
totpages: Total number of allocated pages
pslab: Number of pages per slab
FILES
/proc/meminfo
/proc/stat
/proc/*/stat